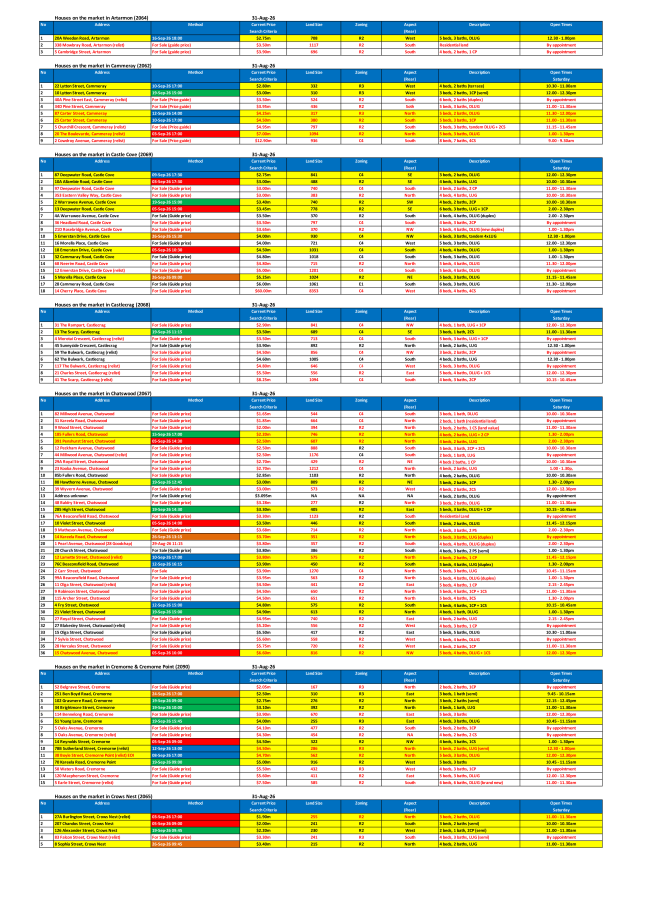
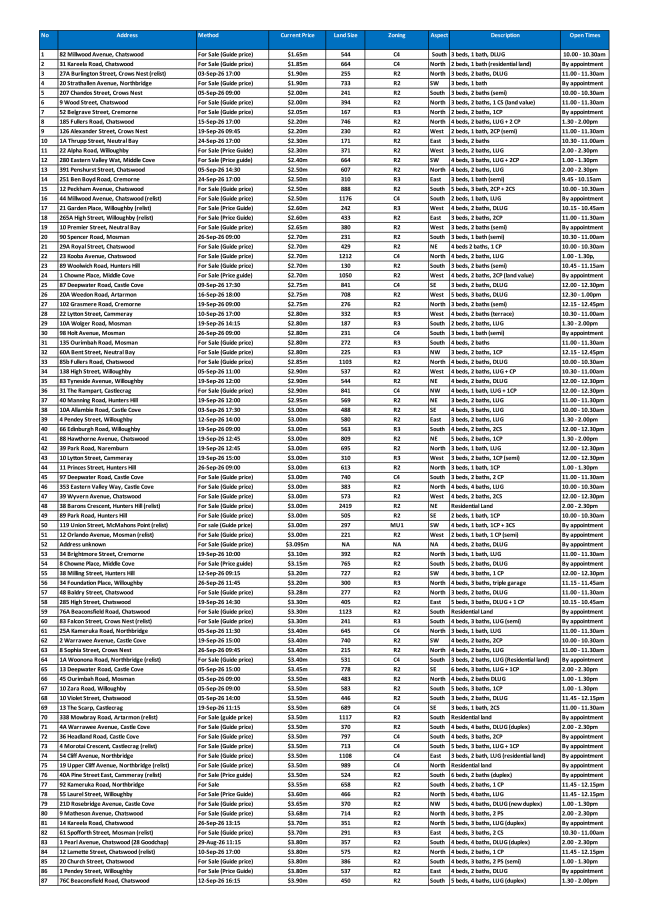
| |

|
Team Howe Weekly
31 August 2026
|
|
The Weekend Edition · Real Insight Weekly
|
|
|
| |
|
Lower North Shore · For Sellers
Choosing the Right Agent
Six tests every seller should apply
before signing anything.
|
| |
|
Dear Readers,
|
| Choosing the person who will sell one of your most valuable assets can be a million-dollar decision — sometimes literally. Yet most sellers choose their agent backwards. |
| They begin with two questions: |
|
“What do you think my home is worth?”
|
|
|
|
|
| Both are legitimate questions — but asked first, they can become traps. The first rewards the agent who quotes the highest number, only to walk you back down once the campaign stalls. The second rewards the cheapest fee over the strongest strategy, judgement and negotiation. |
| The right question isn’t who promises the most. It’s who can prove the most — and who will tell you the truth when the truth is inconvenient. |
| Here are six tests to run on every agent you meet — including me. |
|
|
| Don’t ask only about their best-ever sale — every agent has a highlight. You’re testing whether they’re transparent about their entire record, not their greatest hit. Markets move and campaigns develop, so you’re not expecting perfect accuracy. You are looking for a pattern, honestly explained. An evidence-based agent will walk you through it. A salesperson will change the subject. |
| You are not hiring their highlight reel. You are hiring their average. |
Ask |
“Across your last ten listings, how close was your original price advice to the eventual sale price?” |
|
2 |
Treat the Highest Number as a Claim to Be Proven |
|
| The appraisal that makes you feel best may be the one designed to win your signature — and then condition you down, week by week, when the buyers don’t appear. Make every agent justify their figure against recent comparable sales: |
| Which properties are genuinely comparable — and when did they sell? |
|
| Which competing homes will buyers inspect against yours? |
|
| How have they adjusted for land, condition, position and accommodation? |
|
|
|
| The right agent brings evidence. The wrong one brings enthusiasm and a round number. If the appraisal can’t survive that question, it won’t survive the market either. |
Ask |
“Show me the evidence behind your price — not just the price itself.” |
|
3 |
The Cheapest Fee Can Be the Most Expensive Decision |
|
| Commission is visible; the cost of weak advice and negotiation usually isn’t. On a $5 million sale, saving 0.25% in commission is $12,500 before GST — but a result just 1% lower costs you $50,000. |
| Fee matters; what lands in your account matters far more. A discount is no saving if it comes with weaker strategy, less experienced buyer management, or an agent who takes the first easy deal. If an agent cannot calmly defend their own value, ask how they’ll defend yours. |
Ask |
“What will you personally do during the campaign to justify your fee?” |
|
4 |
Can They Actually Negotiate |
|
| Winning the listing is the easy part. The result is won at the pointy end — when one buyer is hesitating, another is holding back, and the agent has to keep both in the game. Ask for a specific, recent example: |
| What was the buyer’s opening offer? |
|
| What did the agent do next? |
|
| How was the price improved? |
|
| Were the deposit, cooling-off or settlement terms strengthened? |
|
| What was the final result, against the original advice? |
|
|
|
| A clear example reveals a negotiator and a process. A vague answer reveals a lister — someone who launches the campaign and hopes the market does the rest. |
| Listing creates the opportunity; negotiation protects the result. |
Ask |
“How do you negotiate when there’s only one serious buyer?” |
|
5 |
Will They Tell You the Truth When It Costs Them? |
|
| This may be the most important test. The agent who tells you what you want to hear to win the listing may later tell the buyer what they want to hear to close the sale. Straight talk before the campaign is one of the best signs of straight dealing during it. |
| If an agent can’t name a single risk in your home, your expectations or the proposed campaign, they either haven’t looked hard enough — or they don’t want the difficult conversation. Notice who is prepared to respectfully disagree with you in the first meeting. That isn’t a lack of respect, it’s the beginning of it. |
| A trustworthy agent will lose the listing rather than win it with a lie. |
Ask |
“What concerns you about my home, my expectations or the proposed campaign?” |
|
6 |
A System, Not a Scramble |
|
| Putting a property online is not a strategy. Before you appoint anyone, understand how your home will be positioned, what the first two weeks are meant to achieve, how buyer response will be measured, how often you’ll receive meaningful reports, and what would trigger a change in price or method. |
| You should know who will personally attend inspections, call the buyers, deliver the feedback and run the final negotiation. Avoid agents who currently have 12 to 20 listings at once — how can they cope with the stress? You’re appointing a person and a process — not a logo. |
| “Let’s see how we go” is not a plan. |
Ask |
“Once I sign, who is personally accountable for my result — and what happens if the market rejects our first strategy?” |
|
|
The Real Test
|
| The right agent isn’t the one who makes you feel best in a comfortable appraisal meeting. It’s the one whose advice you’ll still trust in week three — when the feedback is uncomfortable, a decision is needed and real money is on the table. |
| Choose the agent who asks the better questions, shows the evidence, explains the risks, and remains personally accountable when the market starts talking. |
|
“Charm may win the appointment. Evidence, judgement and negotiation win the result.”
|
|
| If you are considering selling and would value a candid, evidence-based conversation about your home, reply to this email or call me. |
| Next week: What Are You Actually Paying an Agent For? |
| |
| |
| |
|
The Lower North Shore Statistics
|
|
Lower North Shore — Weekly Snapshot
Week ending 29 August 2026 compared with 22 August 2026
|
| |
29-Aug |
22-Aug |
Change |
| Number of New Listings |
34 |
17 |
▲ 17 |
| Average Listing Price |
$4,703,000 |
$5,925,000 |
▼ $1,222k |
| Total new listings this week |
220 |
208 |
▲ 12 |
| Total New Listings in 2026 |
974 |
941 |
▲ 33 |
| Total Withdrawn Listings |
167 |
160 |
▲ 7 |
| Median Listing Price for Total Listings |
$4,000,000 |
$4,000,000 |
– |
| Median days on Market for Total Listings |
75 |
88 |
▼ 13 |
| Number of New Sales |
13 |
15 |
▼ 2 |
| Average Sale Price |
$3,649,000 |
$4,608,000 |
▼ $959k |
| Median Days on Market (Sales this week) |
23 |
39 |
▼ 16 |
| Average Sale Price Index (SPI) |
-2.09% |
-7.28% |
▲ 5.19 |
| Total New Sales in 2026 |
587 |
574 |
▲ 13 |
| Median Sale Price for Total Sales |
$3,850,000 |
$3,886,000 |
▼ 36,000 |
| Median days on Market for Total Sales |
30 |
30 |
– |
| Number of Auctions |
82 (37%) |
74 (36%) |
▲ 8 |
| Withdrawn |
7 |
6 |
▲ 1 |
| Passed In |
9 |
7 |
▲ 2 |
| Price adjusted down |
13 |
18 |
▼ 5 |
| Prices adjusted Up |
5 |
6 |
▼ 1 |
| Auction date changed |
7 |
8 |
▼ 1 |
| Domain Auction Result (Sydney 2026) |
57% |
54% |
▲ 3 |
| Domain Auction clearance (Sydney last year) |
73% |
75% |
▼ 2 |
| Domain Sydney Median |
$1,630,000 |
$1,603,500 |
▲ 26,500 |
| Domain Total Sales |
$232,959,068 |
$159,723,888 |
▲ $73,235k |
| REA Auction clearance (NSW) |
42% |
42% |
– |
| Total Auctions scheduled |
771 |
690 |
▲ 81 |
|
|
Source: Lower North Shore house data. Arrows compare 29-Aug with 22-Aug.
|
|
|
Sydney · 20 Suburbs · Houses
Lower North Shore market, 2021–2026
Six calendar years of house sales. 2026 covers 1 January – 31 August only, so its counts and volumes are roughly eight-twelfths of a full year.
|
|
2026 YTD Sales
587
Annualises to ≈882 vs 1,158 in 2025
|
|
|
2026 YTD Volume
$2.70b
2025 full year: $5.97b
|
|
|
2026 Median
$3.85m
Down 8.7% from $4.22m in 2025
|
|
|
2026 Days on Market
30
Longest of the six years (2021: 22)
|
|
|
|
|
Sydney Lower North Shore · Houses · 20 Suburbs
Suburb trends: 2026 versus 2025
2026 covers 1 January – 31 August. Sales are annualised for comparison with full-year 2025; medians and days on market are directly comparable.
|
|
Medians Higher
7 of 20
|
Medians Lower
13 of 20
|
Slower Campaigns
16 of 20
|
Region Median
-8.7%
|
|
| Suburb |
Med 25 |
Med 26 |
Chg |
Sls 25 |
Sls 26 |
Ann |
Chg |
DOM |
| Neutral Bay |
$2.95m |
$3.62m |
+22.6% |
37 |
24 |
36 |
-2.7% |
26 to 27 |
| North Sydney |
$3.17m |
$3.56m |
+12.5% |
30 |
15 |
23 |
-23.3% |
22 to 20 |
| Kirribilli |
$4.30m |
$4.70m |
+9.3% |
17 |
2 |
3 |
-82.4% |
23 to 155 |
| Cremorne / Cremorne Pt |
$4.50m |
$4.86m |
+8.1% |
67 |
30 |
45 |
-32.8% |
30 to 28 |
| McMahons Point |
$3.90m |
$4.13m |
+5.8% |
19 |
10 |
15 |
-21.1% |
28 to 29 |
| Naremburn |
$3.07m |
$3.17m |
+3.3% |
40 |
35 |
53 |
+32.5% |
15 to 29 |
| Castle Cove |
$3.94m |
$4.04m |
+2.5% |
40 |
19 |
29 |
-27.5% |
63 to 31 |
| Northbridge |
$5.30m |
$5.26m |
-0.7% |
85 |
36 |
54 |
-36.5% |
28 to 49 |
| Willoughby |
$3.70m |
$3.60m |
-2.7% |
152 |
74 |
111 |
-27.0% |
23 to 30 |
| Chatswood |
$3.38m |
$3.19m |
-5.5% |
141 |
75 |
113 |
-19.9% |
27 to 34 |
| Wollstonecraft |
$5.45m |
$5.00m |
-8.3% |
12 |
9 |
14 |
+16.7% |
29 to 33 |
| Cammeray |
$3.90m |
$3.55m |
-9.0% |
47 |
23 |
35 |
-25.5% |
28 to 28 |
| Crows Nest |
$3.07m |
$2.73m |
-11.3% |
36 |
19 |
29 |
-19.4% |
23 to 29 |
| Artarmon |
$3.74m |
$3.30m |
-11.7% |
24 |
19 |
29 |
+20.8% |
23 to 28 |
| Middle Cove |
$3.61m |
$3.15m |
-12.7% |
14 |
12 |
18 |
+28.6% |
25 to 48 |
| Hunters Hill |
$4.60m |
$4.00m |
-13.0% |
115 |
54 |
81 |
-29.6% |
30 to 31 |
| Mosman |
$6.00m |
$5.15m |
-14.2% |
223 |
108 |
162 |
-27.4% |
27 to 31 |
| Lavender Bay |
$5.03m |
$4.20m |
-16.4% |
4 |
3 |
5 |
+25.0% |
20 to 56 |
| Castlecrag |
$4.82m |
$3.92m |
-18.7% |
38 |
16 |
24 |
-36.8% |
29 to 46 |
| Waverton |
$5.90m |
$3.73m |
-36.8% |
17 |
4 |
6 |
-64.7% |
23 to 21 |
|
|
|
What the Numbers Say
|
| Prices. 7 of the 20 suburbs are carrying a higher median in 2026 than their full-year 2025 result and 13 are lower. The strongest lifts are Neutral Bay (+22.6%), North Sydney (+12.5%), Kirribilli (+9.3%) and Cremorne / Cremorne Point (+8.1%). The softest are Waverton (-36.8%), Castlecrag (-18.7%), Lavender Bay (-16.4%) and Mosman (-14.2%). |
| Turnover. For every suburb, 2026 is being compared on an annualised basis — 8 out of 12 months. |
| Time on market. 16 suburbs are taking longer to sell than in 2025. Longer campaigns are the single most consistent trend across the region this year — and the best early signal that buyers have regained negotiating room. |
| Read with care. Kirribilli (2), Lavender Bay (3) and Waverton (4) have recorded fewer than eight sales in 2026, so a single premium or discounted result moves their median sharply. Treat those percentage changes as indicative only. |
|
Auction pipeline
82 of 220 current listings (37%) are booked for auction over the next five weeks.
|
37% booked
|
|
| 5 Sep |
12 Sep |
19 Sep |
26 Sep |
3 Oct |
|
|
The final week is still filling — bookings typically land two to three weeks out, so 3 October is shown muted.
|
|
| Selling is slower. Median days on market has climbed every stretch of the cycle — 22 days in 2021 to 30 in 2026. That is the clearest softening signal: buyers have time, and thin-stock pockets skew hard (Kirribilli 155 days on 2 sales, Castlecrag 46). |
|
David’s Take
|
| The first eight months of 2026 confirm the market has shifted from price growth to time. With 587 house sales across the Lower North Shore to 31 August, turnover is annualising at around 882 — roughly 20–25% below 2025’s 1,158 sales. Volume sits at $2.70 billion, while the aggregate median of $3.85m is down around 9% on last year’s $4.22m. I read that drop as mostly mix: thinner trading in the premium pockets is pulling the regional median lower, while individual suburb medians have largely held. |
| Prices are broadly resilient. The region median sits at $3.85m against $4.22m in 2025 and $3.70m in 2021. The ~9% dip is partly mix: thinner trading in the top end (Mosman, Northbridge, Kirribilli) pulls the aggregate median down even where suburb medians hold. |
| The clearest signal is days on market, which has stretched to 30.5 days — the longest of the past six years and up from 22 in 2021. Buyers are not rushing, and vendors are working harder for every sale. Yet values are not collapsing: 34% of the current 224 listings are booked for auction over the next four weeks, so selling intent is still there, even if the spring pipeline looks patchier than last year. |
| We have moved from a seller’s market into a slower, more balanced environment. Price falls are modest and selective; the real adjustment is in volume and campaign length. |
| Caveat — this is based on eight months of data, not a full year for 2026. |
| Have a wonderful weekend. |
| |
| |
⌄ Download This Week’s Reports
|
|
|
|
|
| |
|
New · Team Howe Website
Our new website is now live.
Read every edition of the Team Howe Weekly Newsletter, explore current market insights and find out more about who we are and how we work.
→ Visit Team Howe Website
|
|
| |
| |
|
Explore The Area
Northbridge Interactive Map
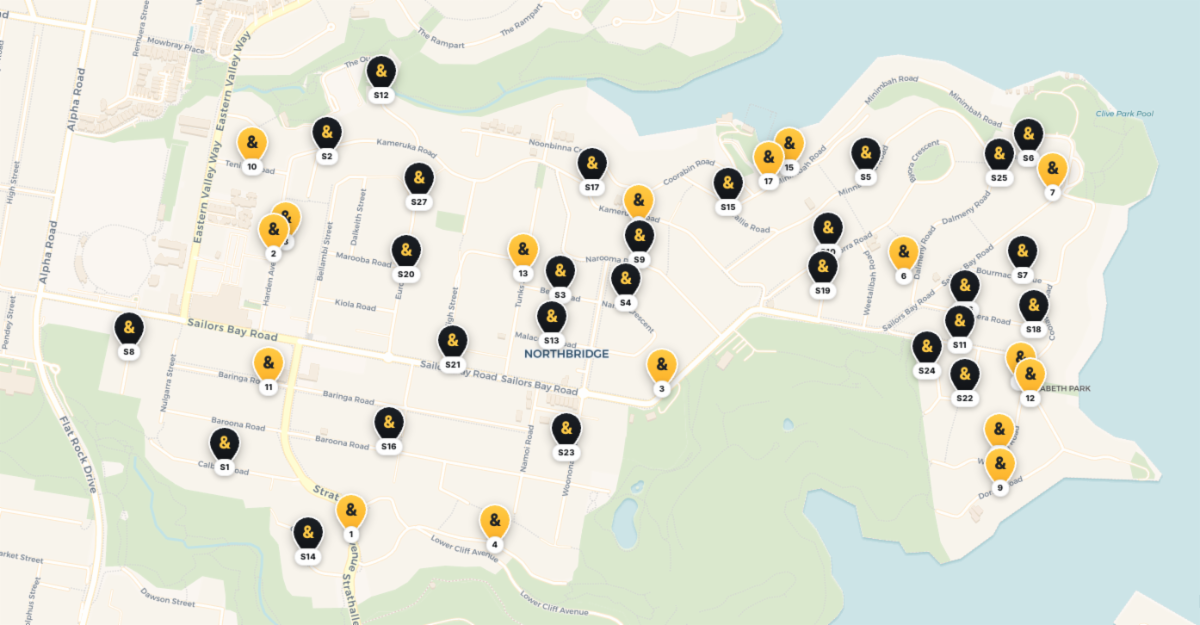 → Click to Explore the Interactive Map
|
| |
|
David Howe
Partner Agent · Raine & Horne Lower North Shore
|
Charles Tang
Team Howe · Raine & Horne Lower North Shore
|
|
|
Lower North Shore
140 Sailors Bay Road, Northbridge NSW 2063
The Weekend Edition · Real Insight Weekly
© Raine & Horne Lower North Shore. You are receiving this because you have previously been in touch with our office about Lower North Shore property.
|
| |