| |

|
Team Howe · 30 July 2026
|
|
Special Report · Market Data
|
|
| |
|
This Week
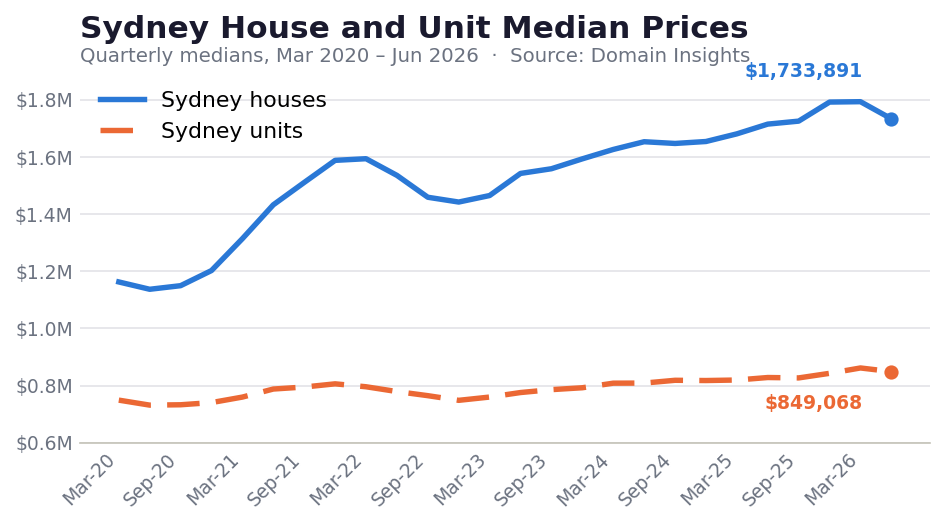
Sydney House & Unit Median Prices
June Quarter 2026 · Quarterly medians, March 2020 – June 2026
Source: Domain Insights
|
| |
|
Houses
Jun 2026
$1.73m
▼ 3.3% qtr
−$59,884
|
Units
Jun 2026
$849,068
▼ 1.5% qtr
−$12,778
|
Houses
Annual
+1.1%
+$18,597
3-yr low
|
Units
Annual
+2.5%
+$20,660
1-yr low
|
|
|
|
|
|
Market Commentary — June Quarter 2026
|
| |
Houses
Sydney house prices declined 3.3% ($59,884) in the June quarter to $1.73 million, falling from the previous quarter’s record high and returning values to June 2025 levels. This marks the first quarterly decline in 3.5 years and the largest fall of any capital city. Annual growth slowed sharply to 1.1% ($18,597), the weakest pace in three years, as borrowing capacity and affordability constraints weigh on demand. Selling conditions have weakened materially, with clearance rates at their lowest level since April 2020 (48%), withdrawn auctions at a record 29.3%, and longer selling times and higher discounting shifting power to buyers.
|
|
| |
Units
Sydney unit prices declined 1.5% ($12,778) in the June quarter to $849,068, also falling from the previous quarter’s peak and returning to September 2025 levels. This is the first quarterly decline in two years, with annual growth easing to 2.5% ($20,660), the slowest in a year. Units continue to outperform houses, reflecting their relative affordability and narrowing the house-unit price gap to its smallest in 1.5 years. However, declines across both segments point to a broad-based cyclical shift in Sydney’s housing market.
|
|
| |
| |
|
Quarterly Data — March 2020 to June 2026
| Quarter |
Houses |
QoQ % |
Units |
QoQ % |
| Mar-20 | $1,162,876 | +2.41% | $749,264 | +2.40% |
| Jun-20 | $1,137,246 | −2.20% | $731,789 | −2.33% |
| Sep-20 | $1,149,828 | +1.11% | $733,049 | +0.17% |
| Dec-20 | $1,202,804 | +4.61% | $740,662 | +1.04% |
| Mar-21 | $1,314,383 | +9.28% | $759,957 | +2.61% |
| Jun-21 | $1,432,880 | +9.02% | $788,107 | +3.70% |
| Sep-21 | $1,511,122 | +5.46% | $795,131 | +0.89% |
| Dec-21 | $1,588,423 | +5.12% | $806,302 | +1.40% |
| Mar-22 | $1,594,192 | +0.36% | $796,064 | −1.27% |
| Jun-22 | $1,535,869 | −3.66% | $779,309 | −2.10% |
| Sep-22 | $1,459,299 | −4.99% | $764,875 | −1.85% |
| Dec-22 | $1,442,519 | −1.15% | $748,577 | −2.13% |
| Mar-23 | $1,465,323 | +1.58% | $760,047 | +1.53% |
| Jun-23 | $1,542,688 | +5.28% | $775,852 | +2.08% |
| Sep-23 | $1,559,090 | +1.06% | $785,971 | +1.30% |
| Dec-23 | $1,593,723 | +2.22% | $792,600 | +0.84% |
| Mar-24 | $1,626,551 | +2.06% | $808,617 | +2.02% |
| Jun-24 | $1,653,635 | +1.67% | $808,951 | +0.04% |
| Sep-24 | $1,647,598 | −0.37% | $818,706 | +1.21% |
| Dec-24 | $1,654,422 | +0.41% | $817,854 | −0.10% |
| Mar-25 | $1,681,183 | +1.62% | $819,663 | +0.22% |
| Jun-25 | $1,715,294 | +2.03% | $828,408 | +1.07% |
| Sep-25 | $1,725,732 | +0.61% | $827,020 | −0.17% |
| Dec-25 | $1,792,415 | +3.86% | $843,076 | +1.94% |
| Mar-26 | $1,793,775 | +0.08% | $861,846 | +2.23% |
| Jun-26 | $1,733,891 | −3.34% | $849,068 | −1.48% |
|
|
Source: Domain Insights (Sydney-wide quarterly medians). Sydney-wide figures are market context only and may differ from Lower North Shore suburb-level results. General information, not financial or property advice.
|
| |
|
New · Team Howe Website
Our new website is now live.
Read every edition of the Team Howe Weekly Newsletter in one place, explore current market insights and find out more about who we are and how we work.
→ Visit Team Howe Website
|
|
| |
| |
|
Explore The Area
Northbridge Interactive Map
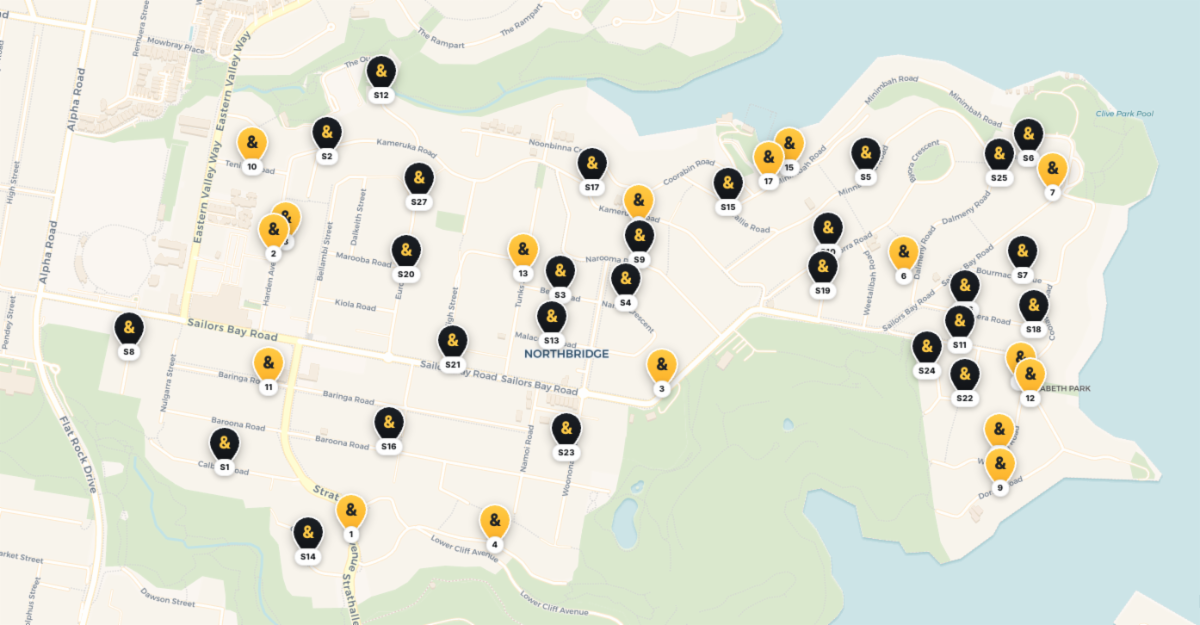
→ Click to Explore the Interactive Map
|
| |
|
David Howe
Partner Agent · Raine & Horne Lower North Shore
|
Charles Tang
Team Howe · Raine & Horne Lower North Shore
|
|
|
Lower North Shore
140 Sailors Bay Road, Northbridge NSW 2063
Prepared by David Howe, Team Howe — Raine & Horne Lower North Shore. Data compiled by Domain Insights (Sydney-wide medians). Sydney-wide figures are market context only and may differ from Lower North Shore suburb-level results. General information, not financial or property advice.
© Raine & Horne Lower North Shore. You are receiving this because you have previously been in touch with our office about Lower North Shore property.
|
| |
|