| |

|
Team Howe Weekly
28 August 2026
|
|
The Weekend Edition · Real Insight Weekly
|
|
|
| |
|
Lower North Shore · 2021–2026
Eight months in:
price, time and the market
Comparing 2026 to every year since 2021 —
and the one number that tells the story.
|
| |
|
Dear Readers,
|
| Interesting statistics below as we wrap up eight months of sales in the Lower North Shore and compare them against 2021 right up to August 2026. |
|
Eight Months of Sales · 2021–2026
|
|
Lower North Shore market, 2021–2026
Six calendar years of house sales. 2026 covers 1 January – 28 August only, so its counts and volumes are roughly seven-twelfths of a full year.
|
|
2026 YTD Sales
578
Annualises to ≈879 vs 1,158 in 2025
|
|
|
2026 YTD Volume
$2.65b
2025 full year: $5.97b
|
|
|
2026 Median
$3.90m
Down 7.6% from $4.22m in 2025
|
|
|
2026 Days on Market
30
Longest of the six years (2021: 22)
|
|
|
|
|
Volume and turnover
Bars: total sales volume ($bn). Pills: number of sales that year.
|
|
≈1,290
|
≈1,000
|
≈1,010
|
≈1,120
|
1,158
|
578
|
| 2021 |
2022 |
2023 |
2024 |
2025 |
2026* |
|
|
*2026 is part-year (to 28 Aug). Sales counts for 2021–2024 read from the chart.
|
|
|
Price versus time
Bars: median days on market. Pills: region median sale price.
|
|
$3.70m
22
|
$3.78m
25
|
$4.13m
26
|
$3.94m
26
|
$4.22m
26
|
$3.86m
30
|
| 2021 |
2022 |
2023 |
2024 |
2025 |
2026 |
|
|
|
|
|
2026 year to date by suburb
Change columns compare 2026 YTD with full-year 2025. Suburbs with only a handful of sales are statistically noisy.
|
| Suburb |
Sales |
Median |
vs 25 |
DOM |
vs 25 |
| Mosman | 107 | $5.10m | -15.0% | 31 | +4 |
| Chatswood | 74 | $3.24m | -4.1% | 35 | +8 |
| Willoughby | 73 | $3.60m | -2.7% | 30 | +7 |
| Hunters Hill | 53 | $4.00m | -13.0% | 31 | +1 |
| Northbridge | 36 | $5.26m | -0.7% | 49 | +21 |
| Naremburn | 33 | $3.20m | +4.3% | 29 | +14 |
| Cremorne / Cremorne Pt | 30 | $4.86m | +8.1% | 28 | -2 |
| Neutral Bay | 24 | $3.62m | +22.6% | 27 | +1 |
| Cammeray | 22 | $3.57m | -8.5% | 28 | +3 |
| Artarmon | 19 | $3.30m | -11.7% | 28 | +5 |
| Castle Cove | 19 | $4.04m | +2.5% | 31 | -32 |
| Crows Nest | 19 | $2.73m | -11.3% | 29 | +6 |
| North Sydney | 15 | $3.56m | +12.5% | 20 | -2 |
| Castlecrag | 14 | $3.80m | -21.2% | 67 | +38 |
| Middle Cove | 12 | $3.15m | -12.7% | 48 | +23 |
| McMahons Point | 10 | $4.13m | +5.8% | 29 | +1 |
| Wollstonecraft | 9 | $5.00m | -8.3% | 33 | +4 |
| Waverton | 4 | $3.73m | -36.8% | 21 | -2 |
| Lavender Bay | 3 | $4.20m | -16.4% | 56 | +36 |
| Kirribilli | 2 | $4.70m | +9.3% | 155 | +132 |
|
|
|
Auction pipeline
76 of 224 current listings (34%) are booked for auction over the next four weeks.
|
34% booked
|
|
| 5 Sep |
12 Sep |
19 Sep |
26 Sep |
|
|
The final week is still filling — bookings typically land two to three weeks out, so 26 September is shown muted.
|
|
| |
| |
|
David’s Take
|
| The first eight months of 2026 confirm an important change in the Lower North Shore market. The issue isn’t simply price. It’s time. |
| With 578 house sales across the Lower North Shore to 28 August, turnover is annualising at around 890 sales — approximately 20–25% below the 1,158 sales recorded in 2025. Total sales volume sits at approximately $2.67 billion, while the aggregate median of $3.86 million is around 8% below last year’s $4.22 million. |
| I would be careful interpreting that median as an 8% fall in property values. Much of the difference appears to be sales mix. There has been thinner trading in some of the premium price brackets, which pulls the overall regional median lower, while individual suburb medians have generally proved more resilient. |
|
The Number I’m Watching: 30.5 Days
|
| For me, the clearest signal in the data is days on market. It has now stretched to 30.5 days — the longest of the past six years, compared with just 22 days in 2021. |
| That tells us something important about buyer psychology. Buyers haven’t disappeared. They’re simply not rushing. They’re inspecting more properties, comparing more sales, questioning price guides and taking longer before committing. |
| At the same time, some vendors are still entering today’s market with yesterday’s price expectations. That’s where campaigns can get into trouble. |
|
Spring Will Be an Important Test
|
| Values are not collapsing across the Lower North Shore in the way we’ve seen reported in some other parts of Sydney. Selling intent also remains healthy. Of the 224 houses currently listed, approximately 34% are already scheduled for auction over the next four weeks — effectively the opening month of the Spring selling season. |
| The question is whether the buyers will meet the vendors at their expectations. That’s what I’ll be watching closely during September. |
|
Three Things I Would Say to Any Vendor Today
|
|
1. Moving the auction date doesn’t solve a pricing problem.
If buyer feedback is consistently telling you the property is positioned above where the market sees value, simply pushing ahead to auction — or moving the auction forward — doesn’t change that evidence. Review the price, presentation and strategy before you review the calendar.
|
|
|
2. Be very careful with the highest appraisal.
Every agent knows that an optimistic price can help win a listing. But an appraisal isn’t a promise. It should be an evidence-based assessment of the market on that particular day. Ask to see the comparable sales. Ask what competing properties buyers will inspect. Ask how the agent arrived at the number.
If a property subsequently needs to reduce its expectations by several hundred thousand dollars — and in some cases close to $1 million — it’s reasonable to ask whether the original positioning was supported by the evidence in the first place.
|
|
|
3. Don’t choose an agent on commission and appraisal alone.
In a slower market, time, service and negotiation become more valuable, not less. Ask yourself:
| Will this agent personally work my buyers? |
|
| Will they follow up every inspection? |
|
| Will they tell me the truth when the feedback isn’t what I want to hear? |
|
| Will they change strategy when the evidence changes? |
|
| And when the right buyer finally appears, will they have the time and skill to negotiate every last dollar? |
|
A low commission means very little if the final sale price is hundreds of thousands of dollars below what could have been achieved. Likewise, a high appraisal means nothing unless the market ultimately agrees.
The agent you choose should have the time to manage your campaign, the evidence to guide your decisions and the negotiation skills to finish the job.
|
|
| I don’t believe we’re entering a collapsing Lower North Shore market. I believe we’re entering a less forgiving one. |
| Good properties will still sell well. Premium results will still happen. But buyers have more time, more information and less fear of missing out. That means vendors need to be equally disciplined. |
| Price it intelligently. Present it properly. Listen to the evidence. And when the market speaks, respond. Because the market may take longer to give you the answer in 2026. |
|
But the market never lies.
|
|
| Have a wonderful weekend. |
| |
| |
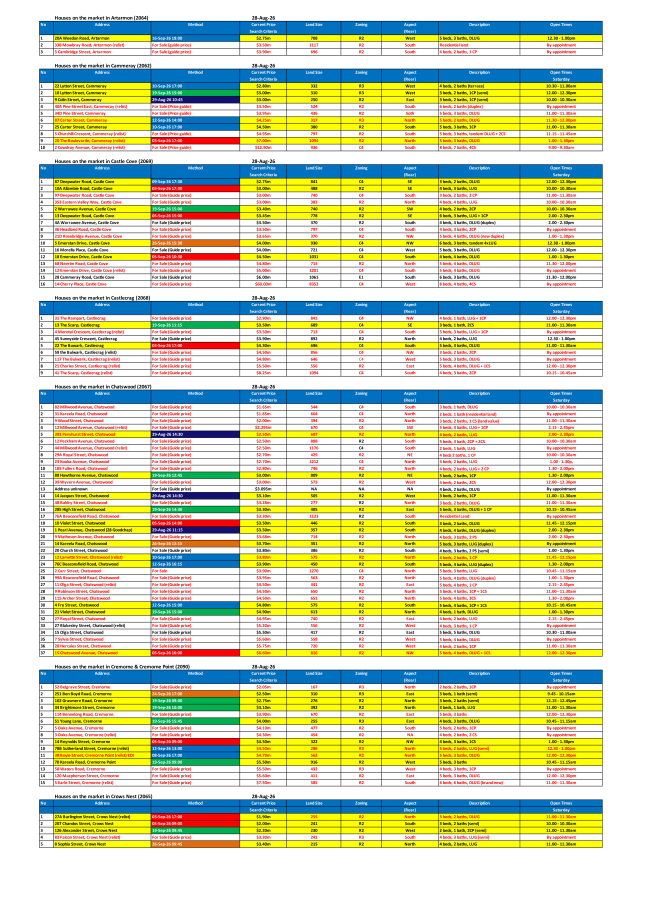
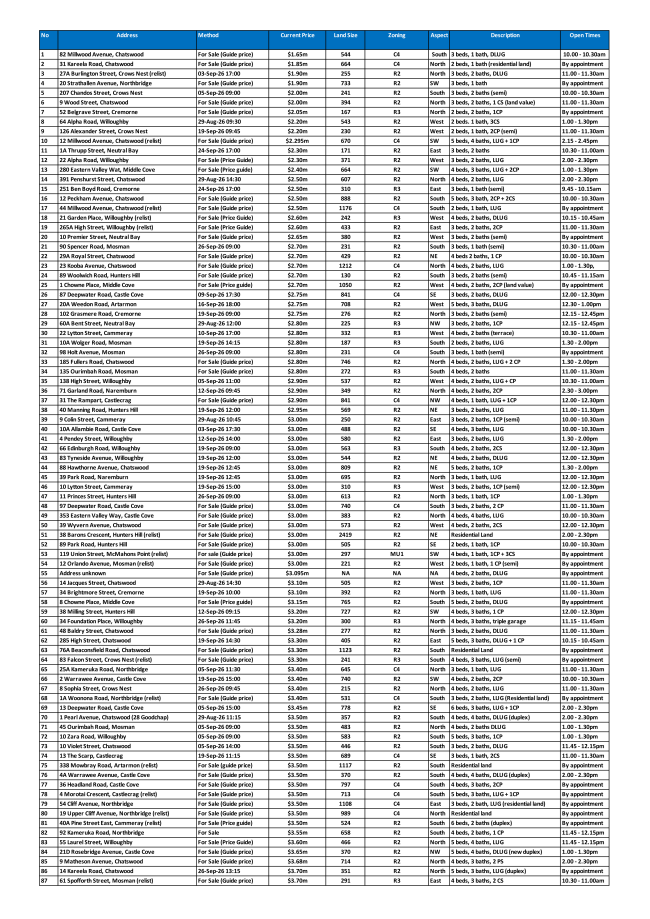
⌄ Download This Week’s Reports
|
|
|
|
|
| |
|
New · Team Howe Website
Our new website is now live.
Read every edition of the Team Howe Weekly Newsletter, explore current market insights and find out more about who we are and how we work.
→ Visit Team Howe Website
|
|
| |
| |
|
Explore The Area
Northbridge Interactive Map
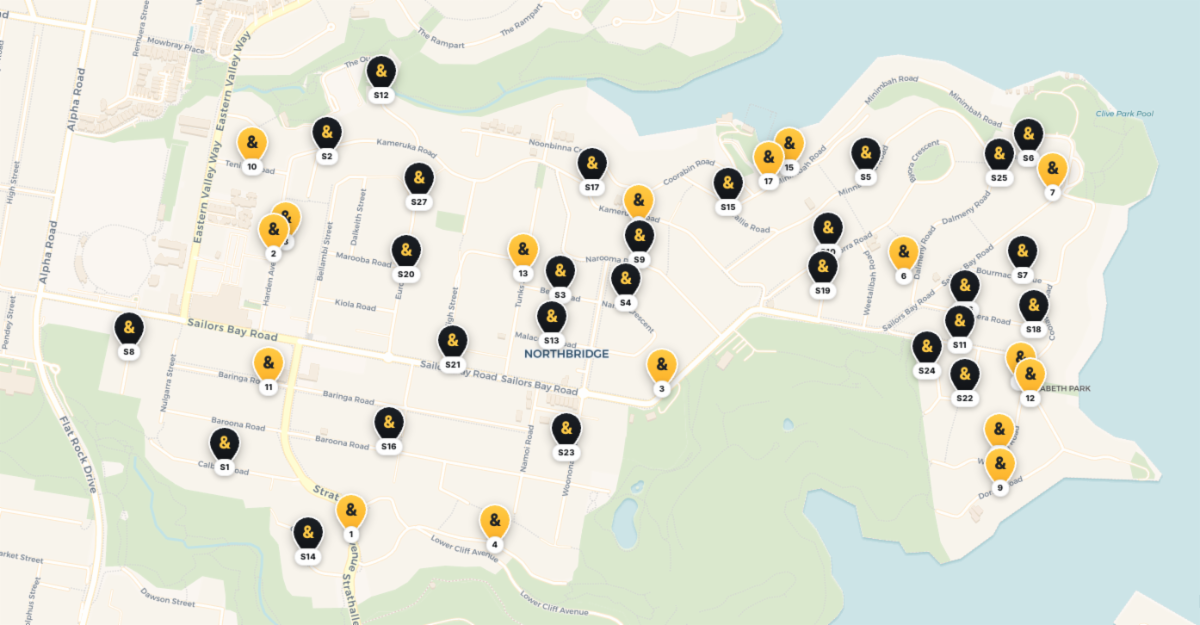 → Click to Explore the Interactive Map
|
| |
|
David Howe
Partner Agent · Raine & Horne Lower North Shore
|
Charles Tang
Team Howe · Raine & Horne Lower North Shore
|
|
|
Lower North Shore
140 Sailors Bay Road, Northbridge NSW 2063
The Weekend Edition · Real Insight Weekly
© Raine & Horne Lower North Shore. You are receiving this because you have previously been in touch with our office about Lower North Shore property.
|
| |