| |

|
Team Howe Weekly
21 August 2026
|
|
The Weekend Edition · Real Insight Weekly
|
|
|
| |
|
Lower North Shore · August 2026
The market never lies:
price, time and 215 listings
Nearly half the homes for sale have sat past three months.
The numbers show why.
|
| |
|
Dear Readers,
|
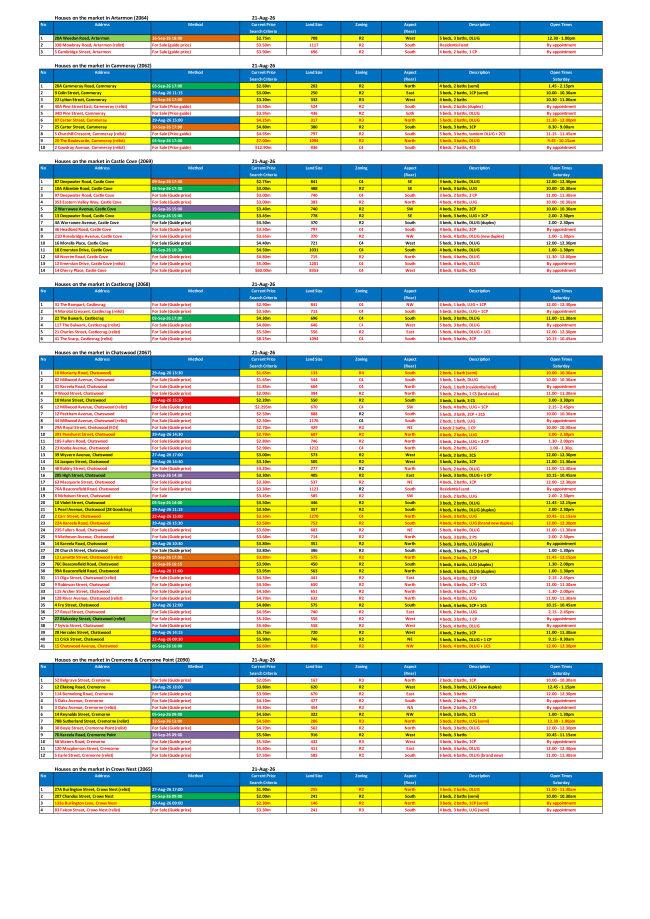
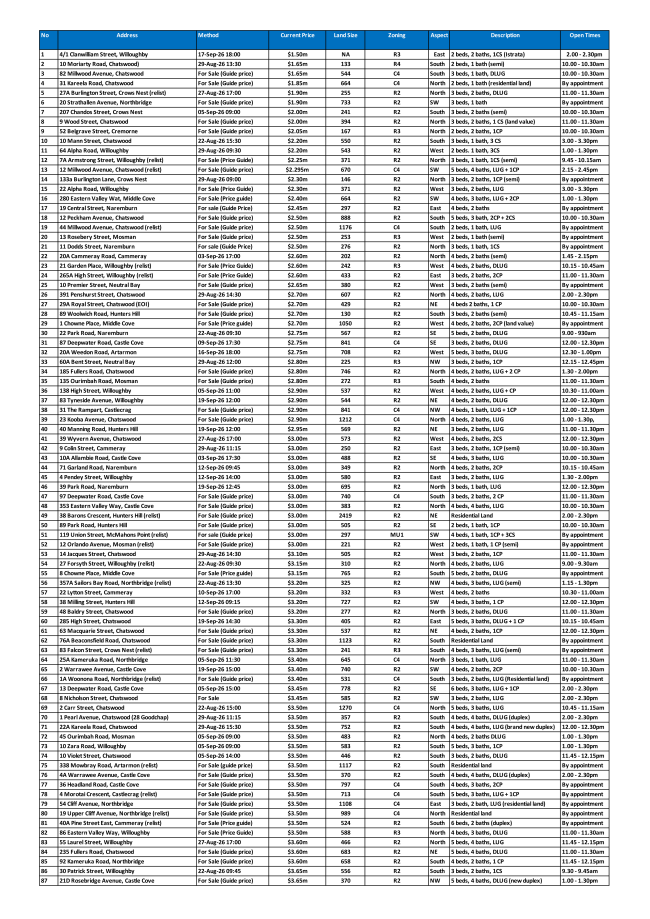
| Today, there are 215 houses currently on the market across the Lower North Shore. Nearly half have been listed for more than three months. |
| And when you look closely at the numbers, a clear pattern emerges: the further a property’s price expectations sit above where buyers see value, the longer it tends to remain on the market. |
| Study the numbers below and draw your own conclusions. But one principle is difficult to ignore: |
|
If nothing changes, nothing changes.
|
|
| If the market has rejected a property’s price for 60, 90 or 120 days, simply waiting another month rarely changes the equation. Something has to move — the market, the strategy, the presentation or the price. It’s the current market reality. |
| The market never lies. The question is how quickly we’re prepared to listen. |
|
The market never lies.
How quickly are we prepared to listen?
|
|
|
This Week’s Numbers
|
|
102
of 215 listings past 90 days
|
|
|
47%
of the market is stale
|
|
|
|
17
on the market over a year
|
|
|
|
Stale rate climbs with price
Every listing, grouped by asking price. The darker portion of each bar has been on the market more than 90 days.
| <$2.5m |
$2.5–3.5m |
$3.5–5m |
$5–8m |
$8–12m |
$12m+ |
|
|
|
Most sales happen early — or not at all
Days on market for all 215 listings. The market clears in the first 60 days; after 90 the tail runs for years.
| 0–30 |
31–60 |
61–90 |
91–180 |
181–365 |
365+ |
Days on market
|
|
|
— The Numbers Behind It
| Price Band |
Listings |
Over 90 |
% Stale |
Opens |
By Appt |
Med. Days |
| <$2.5m |
17 |
5 |
29% |
3 |
2 |
127 |
| $2.5–3.5m |
51 |
23 |
45% |
13 |
10 |
155 |
| $3.5–5m |
69 |
31 |
45% |
16 |
15 |
190 |
| $5–8m |
41 |
17 |
41% |
8 |
9 |
149 |
| $8–12m |
18 |
11 |
61% |
9 |
2 |
182 |
| $12m+ |
19 |
15 |
79% |
10 |
5 |
162 |
|
|
| If you’d like a straight read on where your property sits in these numbers — your suburb, your price band, and how buyers are actually responding — reply to this email with your address. No inflated promises. Just the evidence, and what it means for you. |
| Have a wonderful weekend. |
| |
|
Note
Figures reflect houses listed for sale across the Lower North Shore as at 21 August 2026, grouped by advertised price guide and days on market. Full detail is in this week’s reports below.
|
| |
| |
⌄ Download This Week’s Reports
|
|
|
|
|
| |
|
New · Team Howe Website
Our new website is now live.
Read every edition of the Team Howe Weekly Newsletter, explore current market insights and find out more about who we are and how we work.
→ Visit Team Howe Website
|
|
| |
| |
|
Explore The Area
Northbridge Interactive Map
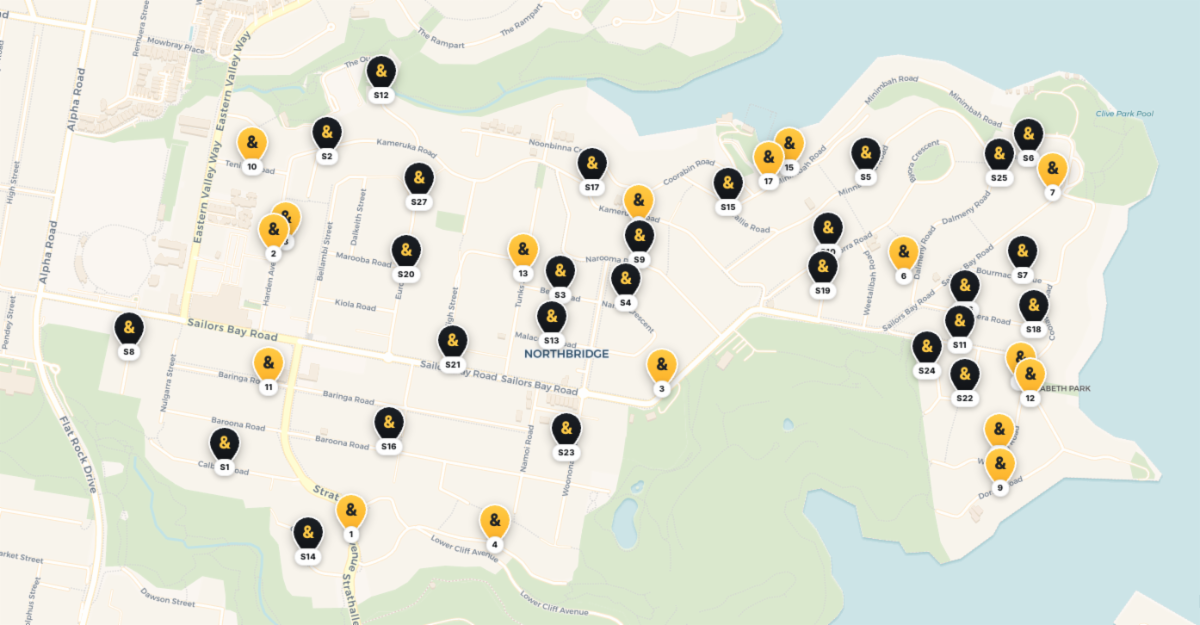 → Click to Explore the Interactive Map
|
| |
|
David Howe
Partner Agent · Raine & Horne Lower North Shore
|
Charles Tang
Team Howe · Raine & Horne Lower North Shore
|
|
|
Lower North Shore
140 Sailors Bay Road, Northbridge NSW 2063
The Weekend Edition · Real Insight Weekly
© Raine & Horne Lower North Shore. You are receiving this because you have previously been in touch with our office about Lower North Shore property.
|
| |