|
|||||||||||||||||||||
|
Lower North Shore · 2021–2026
What Six Years of Data RevealPrices are lower. Homes are taking longer |
|||||||||||||||||||||
|
Dear Readers, | |||||||||||||||||||||
| Six years of Lower North Shore data reveal something different about 2026. From 2021 through 2025, either prices held or increased, days on market held or shortened — or both. In 2026, both measures have moved against sellers at the same time. | |||||||||||||||||||||
| The median sale price has fallen to $3.85 million, while median days on market has increased to 30 days. It is the weakest combined reading across the six-year period. | |||||||||||||||||||||
| That does not prove one single cause, but it is difficult to dismiss as statistical noise. Buyers are taking longer to commit, and the homes that sell are doing so at lower prices. | |||||||||||||||||||||
| Volume tells the same story from another direction. | |||||||||||||||||||||
| If the first nine months continue at their current pace, 2026 will finish at approximately 887 sales — the lowest annual total of the six years, behind even 2022 and 2023, which most people remember as slow markets. | |||||||||||||||||||||
| That is not a worst-case forecast. It is simply where the year finishes if the current pace continues. | |||||||||||||||||||||
|
This Is Not a Crash
| |||||||||||||||||||||
| A median of $3.85 million remains within the six-year range of approximately $3.70 million to $4.22 million. This is a pullback — not a collapse. | |||||||||||||||||||||
| The Lower North Shore has experienced difficult periods before. In 2022, only 979 homes sold, yet median days on market remained at 26. What makes 2026 different is the combination: | |||||||||||||||||||||
|
|||||||||||||||||||||
| For sellers, that combination leaves far less room for error. An inflated appraisal is especially dangerous in this market. It may win an agent the listing, but it does not persuade buyers to pay more. It merely postpones the difficult conversation until the home has lost its freshness and the seller has lost leverage. | |||||||||||||||||||||
|
|||||||||||||||||||||
| That is what six years of our own numbers show. Do not choose an agent because they offer the highest figure. Ask them to show you the evidence — and explain what happens if the market does not agree. | |||||||||||||||||||||
|
|||||||||||||||||||||
|
|||||||||||||||||||||
|
|||||||||||||||||||||
|
The $10 Million Cliff
| |||||||||||||||||||||
| 162 days versus 64 days. | |||||||||||||||||||||
| That is the number that matters — not a gentle upward slope, but a cliff at $10 million. | |||||||||||||||||||||
| From below $2 million through to $10 million, campaigns generally run for two to three months. The sample covers more than 190 listings and shows the broader market behaving relatively consistently. | |||||||||||||||||||||
| Above $10 million, median days on market jumps to 162 days — approximately two and a half times longer. This is more than the vague observation that prestige property takes longer to sell. It is a measurable break at a specific price point, and it deserves an explanation. | |||||||||||||||||||||
| Above $10 million, the buyer pool narrows sharply. Recent comparable sales are also less plentiful, making price advice less precise — and an optimistic appraisal harder to challenge quickly. That is exactly where evidence matters most. | |||||||||||||||||||||
| At $6 million, a larger buyer pool and more comparable activity may expose an unrealistic guide within nine weeks. At $15 million, the seller can wait five months for the market to deliver the same answer. | |||||||||||||||||||||
| There are currently 40 listings above $10 million. The data does not suggest that every one is overpriced. It shows that when the price is wrong, the market takes considerably longer to expose it. | |||||||||||||||||||||
|
|||||||||||||||||||||
|
|||||||||||||||||||||
|
Explore The Area
Northbridge Interactive Map
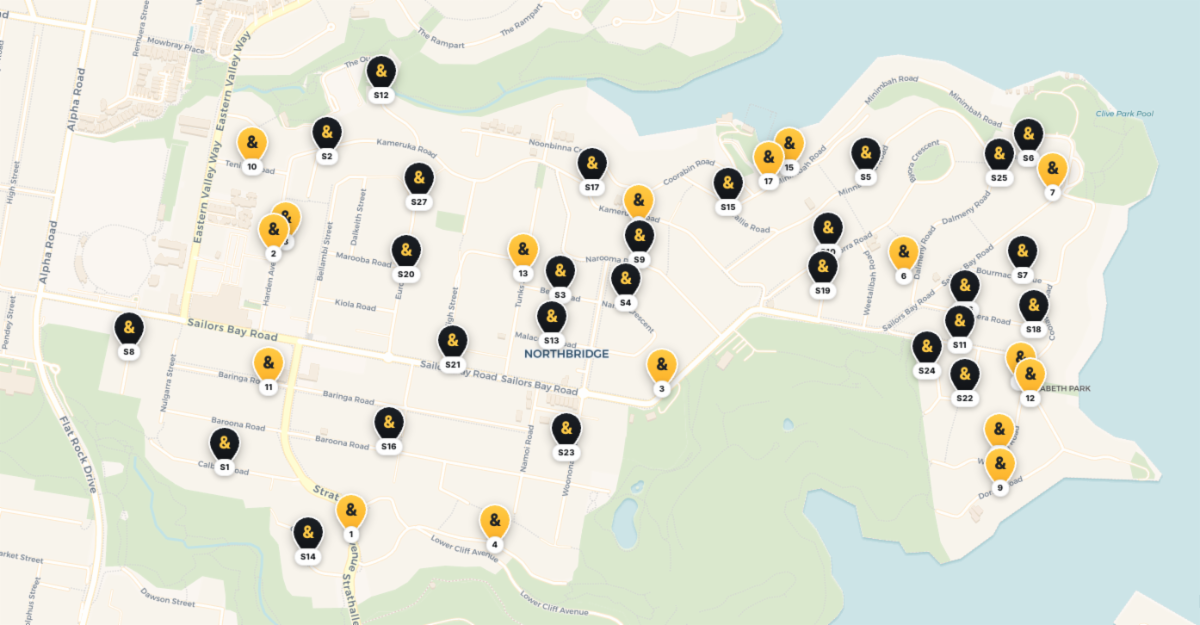 → Click to Explore the Interactive Map |
|||||||||||||||||||||
|
|||||||||||||||||||||

Lower North Shore
140 Sailors Bay Road, Northbridge NSW 2063
The Weekend Edition · Real Insight Weekly
© Raine & Horne Lower North Shore. You are receiving this because you have previously been in touch with our office about Lower North Shore property. |
|||||||||||||||||||||